American Home Equity Reached $34.1 Trillion. Most Homeowners Have Never Thought About What That Means for Them.
A home purchased in the Phoenix metro for $300,000 at the end of 2019 is worth approximately $511,000 today.
That $211,000 did not come from anything the homeowner did. No renovation. No upgrade. It came from holding an asset through one of the strongest six-year appreciation cycles in Arizona’s recorded history.
Most of that money is sitting exactly where it landed. Inside the home. Untouched.
Most homeowners have never had a specific conversation about what their equity position actually is. Not because they are not interested. Because nobody sent them a statement.
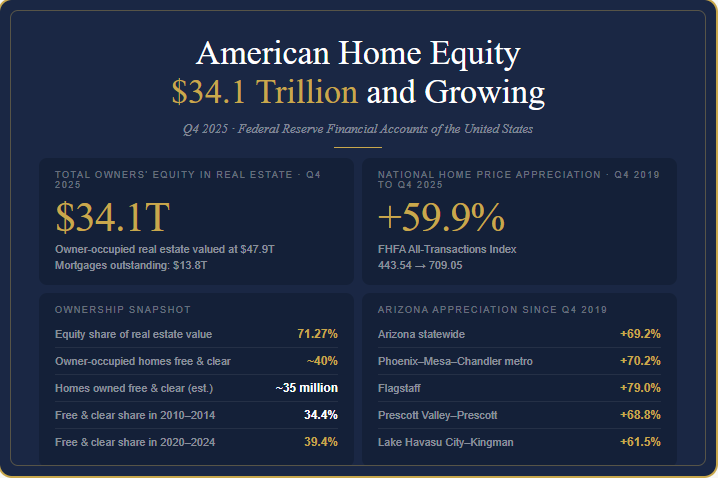
$34.1 Trillion. What That Number Actually Represents.
The Federal Reserve publishes a quarterly Financial Accounts of the United States. The Q4 2025 release shows owner-occupied real estate valued at $47.9 trillion. Against that, residential mortgages outstanding total $13.8 trillion. The difference is $34.1 trillion. That is what American homeowners own above and beyond what they owe.
That equity represents 71.27 percent of the total value of American residential real estate. Homeowners as a group own more than seven tenths of their homes outright.
For context: total American household debt, including mortgages, credit cards, auto loans, and student loans, is $18.776 trillion. Home equity alone is nearly twice that figure.
American homeowners hold $34.1 trillion in equity. All household debt combined is $18.776 trillion. The asset is nearly twice the size of the liability.
Source: Federal Reserve Financial Accounts of the United States, Q4 2025
Four Out of Ten Homeowners Own Their Home Outright
Approximately 40 percent of owner-occupied homes in the United States carry no mortgage. The Census Bureau’s 2024 American Community Survey reported that 59.7 percent of owned homes had a monthly mortgage payment. That means roughly 40.3 percent did not. The Census Bureau estimated approximately 35 million homes owned free and clear.
That share has grown. Five-year Census estimates show it rising from 34.4 percent in the 2010 to 2014 period to 39.4 percent in the 2020 to 2024 period.
For those households, the equity they hold is not offset by any debt service obligation. The asset is simply theirs.
Source: U.S. Census Bureau, 2024 ACS 1-Year Estimates · Census Bureau mortgage-free homes report, January 2026
What Six Years of Appreciation Looks Like on Paper
The Federal Housing Finance Agency publishes an all-transactions house price index tracking repeat sales of actual properties. Here is what that index shows from Q4 2019 to Q4 2025:
United States national: +59.9 percent (index: 443.54 to 709.05)
Arizona statewide: +69.2 percent (index: 432.35 to 731.53)
Phoenix-Mesa-Chandler metro: +70.2 percent (index: 303.69 to 516.83)
Flagstaff: +79.0 percent (index: 278.32 to 498.21)
Prescott Valley-Prescott: +68.8 percent (index: 268.60 to 453.33)
Lake Havasu City-Kingman: +61.5 percent (index: 255.44 to 412.51)
These are not estimates or projections. They are official index values based on what properties actually sold for. The same homes at different points in time.
Arizona has outpaced the national average by nearly ten percentage points statewide. Flagstaff is nearly twenty points above the national figure. A home purchased in the Phoenix metro for $300,000 at the end of 2019 is worth approximately $511,000 today based on that index. That is $211,000 in appreciation. It happened while the owner was living there.
$211,000 in new wealth created on a single Phoenix home since 2019. Not from anything the homeowner did. From holding the asset.
Source: FHFA All-Transactions House Price Index Q4 2025 · FRED Series AZSTHPI
The Equity Is Not Evenly Distributed
The Federal Reserve explicitly noted in its financial stability analysis that gains in real estate have not affected all households equally. Owners who bought long ago, owners without mortgages, and higher-income households have benefited most. Renters, recent buyers, and borrowers already under stress are in a much thinner position.
For Arizona homeowners who purchased before 2022, the appreciation data is clear and significant. For those who purchased more recently, the picture is more nuanced. The aggregate number is $34.1 trillion nationally. What any individual homeowner holds depends entirely on when they bought, what they paid, and what their property is worth today.
Source: Federal Reserve Financial Stability Report, late 2025
What Homeowners Are Starting to Do With It
The Federal Reserve’s April 2026 Senior Loan Officer Opinion Survey found stronger demand for home equity lines of credit across the banking system. HELOC balances grew $11.6 billion in Q4 2025 alone, reaching $434 billion total. The New York Fed reported this expansion has been running continuously since 2022.
That is the same year credit card rates started their sharpest climb in more than two decades.
Demand for credit cards and auto loans in the same April 2026 survey was weakening. Some homeowners are already looking at both sides of their balance sheet. Most are not. Because most have never been shown both sides at the same time.
Source: Federal Reserve April 2026 Senior Loan Officer Opinion Survey · NY Fed Q4 2025
$34.1 trillion in home equity. 40 percent of homeowners with no mortgage. Arizona appreciation of nearly 70 percent since 2019.
The numbers are already there. Most homeowners just have not seen them yet.
One Response