What Happens Next in the Metro Phoenix Housing Market?
Someone recently said to me,
“I know July is going to be bad. What I need to know is what’s going to happen in September.”
He was referring, of course, to the Metro Phoenix Housing Market, and my honest reply was:
“I don’t know what’s going to happen in September. But right now, we’re on the verge of entering an Extreme Buyer’s Market, and by the end of this month, we’ll likely be in one.”
👉 Not sure what an Extreme Buyer’s Market means?
Read our article that explains what these terms really mean.
The Stats That Matter Most Right Now
Every month, I publish a data-driven market update featuring the 15 Key Stats That Reveal Where the Phoenix Housing Market Is Headed. These stats help buyers, sellers, and investors make smarter, more confident decisions.
Of the 15 stats, two jump out at me this month:
- Days on Market:
- In 2024, homes were sitting an average of 68 days, high.
- In 2025, that number has climbed to 84 days, close to very high.
- Supply / Demand Ratio:
- In 2024, we were at 47.33%, just under Balanced Market.
- In 2025, it has dropped to 31.71%, just over an Extreme Buyer’s Market.
This shift is a dangerous combination:
📈 Inventory is up 38%
📉 Homes under contract are down 7.44%
📈 Days to sell a home are up 24%
Buyers are on the sidelines, watching. Concerned about everything from interest rates, inflation, and tariffs to jobs, wars, and economic uncertainty, many are simply waiting to see what happens next.
Optimist or Pessimist?
If you’re an optimist, this might be the perfect time to buy a home in Arizona. Why?
✅ You have leverage.
✅ You have options.
✅ You can negotiate.
✅ Mortgage rates could go lower.
If you’re a pessimist, this market may raise red flags that we’re headed toward a housing correction, or worse.
I am optimistic, however I think it would be foolish to ignore the facts. So let’s take a quick look at where we stand today.
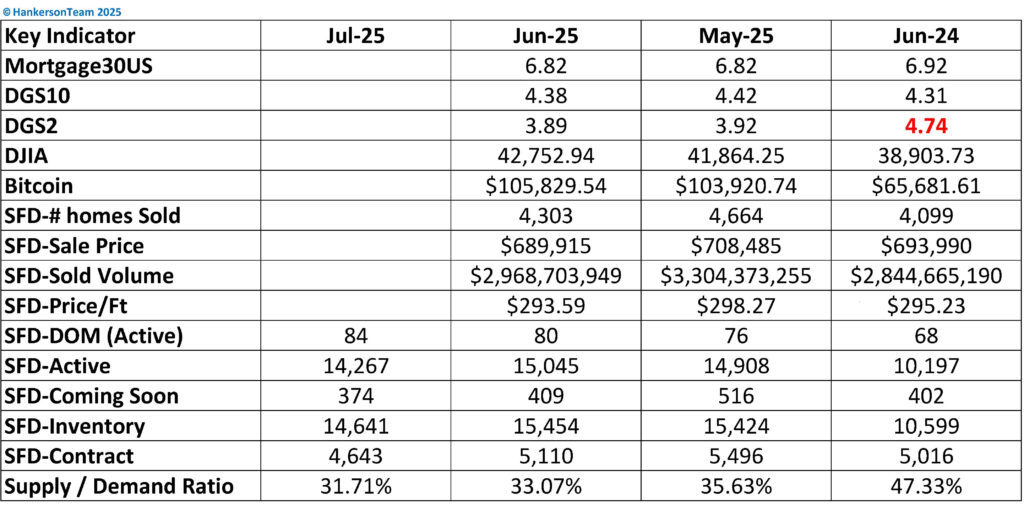
Current Economic Indicators (At a Glance)
- 🏡 30-Year Mortgage Rate: Lower than this time last year and holding steady
- 📉 10-Year Treasury Yield: Down, an indicator that mortgage rates may fall in the future
📌 Get pre-qualified for a Home Loan - 📈 Stock Market & Crypto: Both the Dow Jones and Bitcoin are trending up
- 📉 Local Housing Metrics:
- Homes sold – down
- Average sale price – down
- Total dollar volume – down
- Price per square foot – down
- Days on Market – up
- Supply/Demand Ratio – down
📉 Based on past trends, I anticipate the negative Local Housing Metrics indicators to worsen by the end of July.
So… What Should You Do?
If you’re thinking about buying, selling, or investing in Arizona real estate, now is the time to review your strategy. Market conditions are shifting quickly. Understanding the data and having a clear plan can make all the difference.
☀️ Yes, I’ll be working all summer, even when it’s 110 degrees outside (except for a few days when I will be delivering donations to an orphanage in Mexico, read about last year’s trip here).
📅 Book a call with Michael Hankerson if you’d like to talk through your options.