
U.S. Pending Home Sales Plunge to Record Lows. Metro Phoenix Is Showing Some Troubling Signs.
October 20, 2026
The latest national housing numbers are concerning. Pending home sales across the United States fell 7.3% in September, reaching a record low in the data series going back to 2010.
Compared with September 2025, pending sales were down 11.3%. Compared with September 2019, before the pandemic, they were down nearly 40%.
The western United States experienced an even larger decline, with pending sales falling 9.2% from August and 15% from September of last year.
Meanwhile, the number of existing homes available for sale nationally has reached its highest September level in 11 years.
Fewer buyers are purchasing homes, even as more homes become available.
But what is happening here in Metro Phoenix?
I have been maintaining historical housing market data for years, tracking single-family detached home sales through the Arizona Regional Multiple Listing Service (ARMLS) in Maricopa County.
The latest numbers show that Metro Phoenix is experiencing many of the same challenges as the national market. However, one local indicator stands out more than anything else.
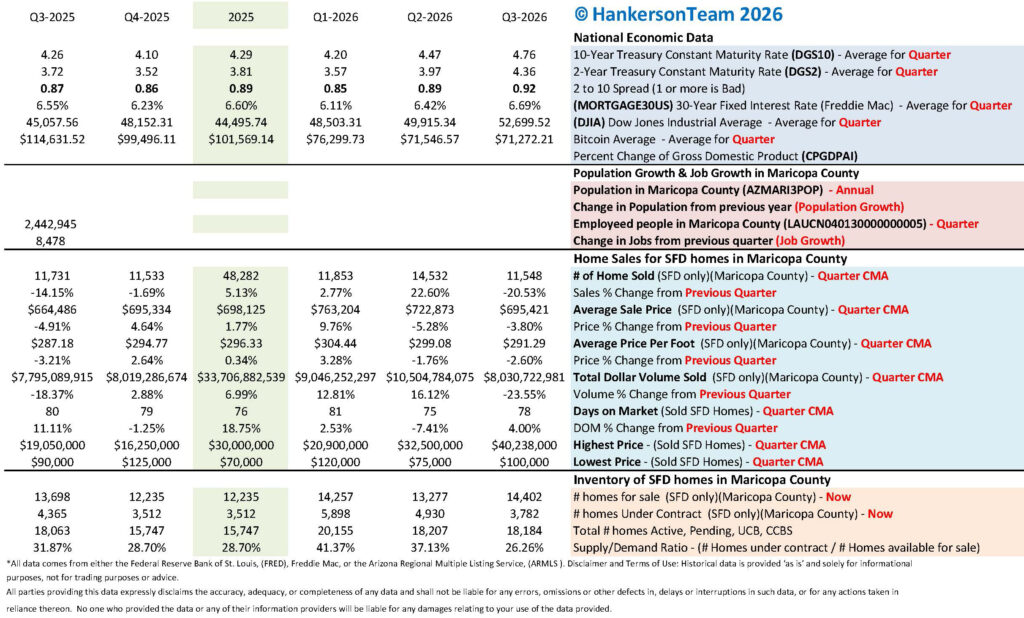
Our supply/demand ratio has dropped to just 26.26%, the lowest reading in the historical market-health snapshots I have dating back to 2019.
That number deserves some attention.
The Most Concerning Number in the Phoenix Housing Market
Each month, I track the number of single-family detached homes available for sale and the number currently under contract.
These figures are snapshots taken on the first of the month. Unlike closed sales, which tell us what happened during the previous month, these numbers provide a picture of current market conditions.
Here is what happened between the September 1 and October 1 snapshots.
Market Indicator | September 1 | October 1 |
Homes for sale, including Coming Soon | 12,943 | 14,402 |
Homes under contract | 4,299 | 3,782 |
Supply/Demand Ratio | 33.21% | 26.26% |
In just one month, the number of homes available for sale increased by 1,459, or 11.3%.
At the same time, the number of homes under contract declined by 517, or 12%.
That combination is what concerns me.
The supply/demand ratio measures the number of homes under contract relative to the number available for sale.
A 26.26% ratio means there are approximately 26 homes under contract for every 100 homes in inventory.
For comparison, the ratio was 36.13% in September 2025 and 33.21% in September 2026.
Looking at the comparable October snapshots, the ratio declined from 31.87% in 2025 to 26.26% this year.
And going back through the historical quarterly snapshots beginning in 2019, I do not find a lower reading.
This is not simply a slow month for home sales. It is a significant deterioration in the balance between available homes and buyer demand.
How Does Today’s Phoenix Market Compare With 2019?
One of the reasons I maintain long-term housing market records is that looking at the previous month or even the previous year does not always provide enough perspective.
Consider the third quarter of 2019, before the pandemic changed the housing market.
At that time, our market-health snapshot showed:
- 9,387 homes available for sale
- 7,039 homes under contract
- A supply/demand ratio of approximately 75%
Compare that with the latest figures:
- 14,402 homes available for sale
- 3,782 homes under contract
- A supply/demand ratio of 26.26%
We now have 53% more homes available for sale and 46% fewer homes under contract than we did in the comparable 2019 snapshot.
That is a substantial difference.
And it is not just the pending sales numbers.
During the third quarter of 2019, 18,771 single-family detached homes sold in Maricopa County.
During the third quarter of 2026, only 11,548 homes sold.
That represents a decline of approximately 38.5%.
This is particularly interesting because the national pending home sales report also shows a decline of nearly 40% compared with September 2019.
Although these are different measurements, the long-term decline in housing activity is apparent nationally and locally.
September Home Sales Actually Improved
Despite the weakness in pending sales, September was a slightly better month for completed home sales than August.
A total of 3,737 single-family detached homes sold in September, compared with 3,607 in August.
That is an increase of 3.6%.
August is traditionally one of our slower months in Arizona. With temperatures frequently exceeding 110 degrees and many winter visitors out of town, slower summer sales activity is expected.
September sales were still 5.4% below September 2025, when 3,949 homes sold.
However, there is another important part of the story.
Through the first nine months of 2026, a total of 37,933 single-family detached homes sold, compared with 36,749 during the same period in 2025.
That is actually an increase of 3.2%.
So while the market has certainly been slow compared with historical levels, more homes have sold during the first nine months of this year than during the same period last year.
This is why I think it is important to look beyond the monthly closing numbers.
The completed sales figures show that the market has continued functioning, even with fewer transactions than we experienced before the pandemic.
The inventory and pending contract figures, however, suggest that the coming months could be more challenging.
Home Prices Have Not Followed Sales Activity Down
Another interesting aspect of the Metro Phoenix housing market is what has happened to home prices.
In September 2026, the average single-family detached home sold for $686,029.
That compares with $678,081 in September 2025, an increase of approximately 1.2%.
Average price per square foot also increased from $288.59 to $292.09.
Looking at the entire third quarter provides a similar picture.
The average sale price during Q3 2026 was $695,421, compared with $664,486 during Q3 2025.
That is an increase of approximately 4.7%.
Average price per square foot increased from $287.18 to $291.29 during the same period.
However, there was a decline between the second and third quarters of this year. Average price per square foot fell from $299.08 in Q2 to $291.29 in Q3.
These figures show why we need to consider both seasonal changes and year-over-year comparisons.
The number of homes being sold is substantially lower than it was several years ago, but average sale prices have remained relatively resilient.
That does not mean every home’s value has increased.
Average prices can be influenced by the mix of homes being sold. Scottsdale, Paradise Valley, the West Valley, and other parts of Maricopa County do not necessarily experience the same conditions at the same time.
The overall numbers tell us what is happening across the market. Individual properties still need to be evaluated against their direct competition.
What Happened to the Housing Market After 2021?
Looking at our historical data, the change in transaction volume is remarkable.
In 2021, 72,728 single-family detached homes sold in Maricopa County.
By 2022, that number had fallen to 55,082.
Sales declined again to 45,950 in 2023 and remained almost unchanged at 45,927 in 2024.
There was a modest improvement in 2025, with 48,282 homes sold.
The rapid increase in home prices during 2020 and 2021 coincided with extraordinarily low mortgage interest rates.
Many homeowners purchased or refinanced their properties with mortgage rates near 3%.
When mortgage rates increased, the economics of buying and selling changed.
Homeowners with low-rate mortgages became reluctant to give up their existing financing. Buyers faced much higher monthly payments, even when purchasing similarly priced homes.
The result has been several years of reduced transaction activity.
But the price adjustment has been much smaller than the decline in the number of homes sold.
That has created a difficult situation where many buyers cannot comfortably afford the homes they want, while sellers remain reluctant to accept lower prices.
Mortgage Rates and Affordability Continue to Be Major Problems
The national report also highlights the continuing impact of mortgage rates.
The Freddie Mac 30-year fixed mortgage rate reached 7.40% in its latest weekly reporting period.
In our September monthly data, the average was 6.86%, compared with 6.35% in September 2025.
Mortgage rates are not the only issue affecting affordability, but they have a substantial impact on monthly payments.
And I believe this is where buyers may need to approach the market differently.
Rather than focusing exclusively on a home’s asking price or hoping mortgage rates decline, buyers should consider beginning with the monthly payment they want to have.
For example, suppose a buyer wants a principal and interest payment of $2,500 per month.
We can work backward from that payment to determine the loan amount supported at different interest rates, then account for the down payment, property taxes, insurance, and other costs to establish an appropriate purchase price.
From there, we can evaluate whether negotiating a lower price, requesting seller concessions, or using a mortgage rate buydown provides the better result.
In a market with increasing inventory and fewer homes under contract, buyers may have negotiating opportunities that were not available a few years ago.
The objective should not simply be getting the lowest possible interest rate.
It should be purchasing the right home with financing and a monthly payment that make sense.
What Does This Mean for Home Sellers?
For sellers, the situation is becoming more challenging.
There are more homes available for sale, fewer homes under contract, and buyers have more choices.
That does not mean a home cannot sell.
It does mean that pricing, condition, presentation, and competition deserve more attention.
A homeowner may have invested substantial money in remodeling, improvements, or maintenance. Those improvements can certainly make a property more attractive.
However, buyers still compare that home with the other properties they can purchase for the same money.
When inventory increases and the number of active buyers declines, sellers have less room to ignore that competition.
A home that would have attracted multiple offers in 2021 may now need a different pricing and marketing strategy.
And when a seller’s asking price is significantly above comparable properties, buyers may never schedule a showing.
The challenge is not necessarily convincing buyers that a home is beautiful or well-maintained.
It is demonstrating that the home represents a competitive value compared with the alternatives available.
Is Metro Phoenix Becoming a Buyer’s Market?
The supply/demand numbers certainly indicate that buyers have gained negotiating leverage.
However, I would be careful about assuming that every property and every neighborhood is experiencing the same conditions.
Some homes are still selling relatively quickly. Others are remaining on the market considerably longer.
What matters is the relationship between available homes and qualified buyers within a particular neighborhood and price range.
The broader market, however, is showing a clear imbalance.
The October 1 snapshot shows 14,402 homes available for sale and only 3,782 under contract.
That is a supply/demand ratio of 26.26%.
It is the lowest ratio in the historical quarterly snapshots I have available dating back to 2019, and it is moving in the wrong direction.
For sellers, that means greater competition and potentially more pressure on pricing.
For buyers, it may mean more opportunities to negotiate terms that fit their financial needs.
But a weaker market does not necessarily mean every home is a bargain. Buyers still need to evaluate individual properties and understand the financing.
Where Do We Go From Here?
The national pending home sales report raises serious questions about the direction of the housing market.
Here in Metro Phoenix, the historical data and current market indicators suggest we are experiencing many of the same problems.
Completed home sales are running slightly ahead of last year, and average sale prices remain above year-ago levels.
Those are positive signs.
But the market-health indicators tell a different story.
Inventory is increasing. Pending contracts are declining. And the supply/demand ratio has fallen to its lowest recorded level in years.
The question now is whether buyers will return to the market in sufficient numbers to absorb the growing inventory or whether sellers will need to make additional price adjustments to attract them.
Mortgage rates, affordability, employment, consumer confidence, and the willingness of buyers and sellers to negotiate will all play a role.
What concerns me most is the speed at which the supply/demand ratio deteriorated during the latest monthly reporting period.
Going from 33.21% to 26.26% in just one month is a significant change.
We are not seeing a collapse in average home prices. We are seeing a serious weakening in the relationship between the number of homes available for sale and the number of buyers moving forward with purchases.
And that is something both buyers and sellers need to understand before making their next real estate decision.
The Metro Phoenix housing statistics in this report cover single-family detached homes recorded through ARMLS in Maricopa County. They do not include condominiums, townhomes, or new construction not recorded through the MLS. Monthly completed-sales figures and first-of-month inventory and contract snapshots measure different aspects of market activity. The national pending-sales figures measure new contract activity and are seasonally adjusted, while the local SFD-Contract figures measure the number of homes under contract at a point in time.