November 2025 Metro Phoenix Housing Market Update
Metro Phoenix Housing Market Update — November 2025
Prepared for clients of Hankerson Team | Luxury Division
By Michael Hankerson, Designated Broker
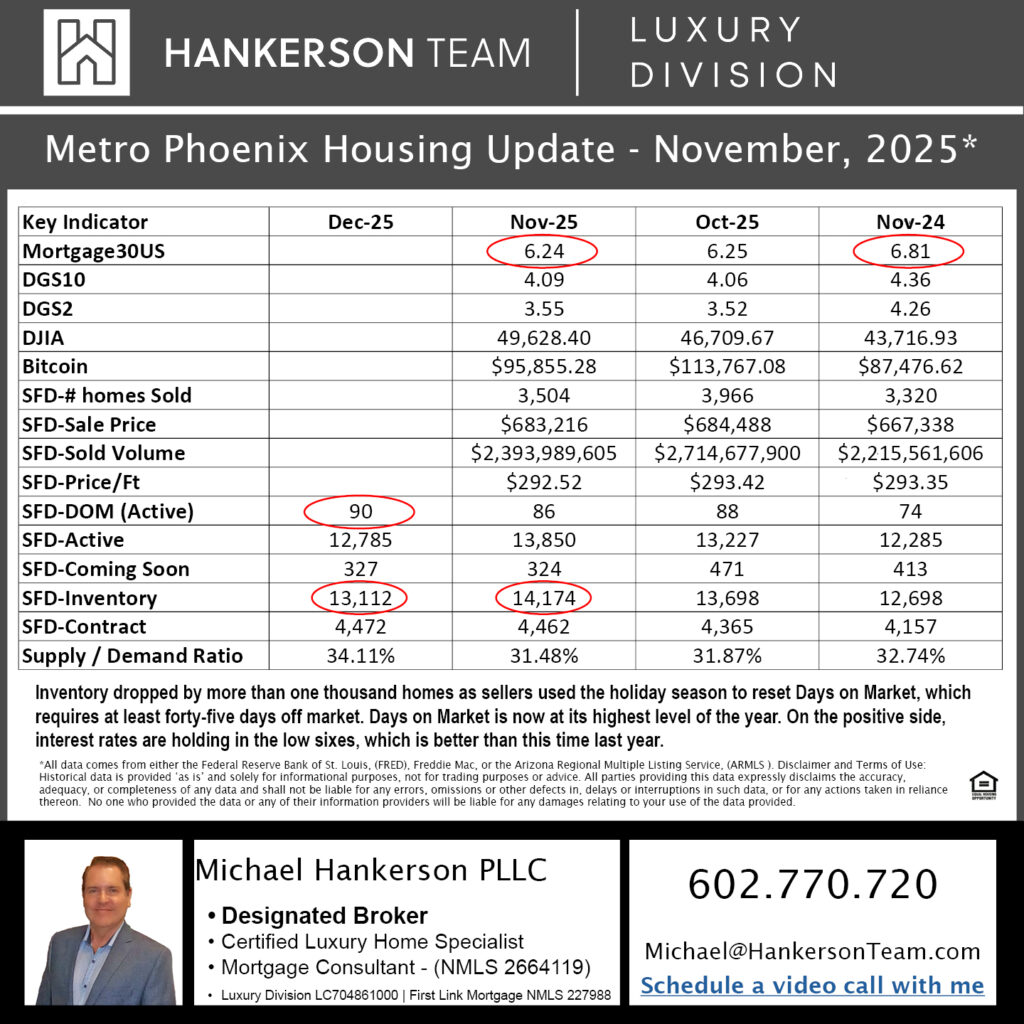
November brought a seasonal shift in the Metro Phoenix housing market with easing mortgage rates, declining inventory, consistent pricing, and a Supply and Demand Ratio that remains favorable for buyers even as it begins to move gradually toward long-term balance. The following breakdown reflects all 15 key indicators and what they tell us as we move through December and prepare to close out 2025.
- Interest Rates and Economic Conditions
30 Year Mortgage Rate: 6.24 percent
10 Year Treasury: 4.09 percent
2 Year Treasury: 3.55 percent
Rates held steady in the low sixes as inflation cooled and bond yields edged lower. This stability has improved purchasing power compared to last year when mortgage rates were 6.81 percent. Buyers who were waiting for steadiness rather than major rate reductions are beginning to re-engage.
- Financial Markets and Buyer Liquidity
Dow Jones: 49,628
Bitcoin: 95,855
Strong equity performance and elevated cryptocurrency levels continued to support liquidity for higher end and investment driven buyers. While Bitcoin has retreated from earlier peaks, it remains significantly above last year which has contributed to solid cash activity.
- Sales Activity and Pricing
Closed Sales (SFD)
3,504 sales
This is down from October’s 3,966 which reflects normal holiday-season slowing as buyers shift attention to travel, family, and financial planning.
Average Sale Price (SFD)
683,216 dollars
Average pricing remained extremely stable and nearly identical to October. This consistency reinforces the conclusion that the market is calm, rational, and functioning without volatility.
Sold Volume
2.39 billion dollars
Lower than October’s 2.71 billion dollars largely due to reduced transaction count, not falling prices.
Average Price Per Square Foot
292.52 dollars
This number has been remarkably consistent throughout the year which signals a predictable and steady valuation environment across Metro Phoenix.
- Days on Market
Active Days on Market: 90 days
Up from 86 in October and 74 a year ago. Buyers are taking more time before writing offers which is normal for a market that has transitioned out of the rapid pace seen during the boom years.
- Inventory and Seasonal Movement
Inventory is Active listings plus Coming Soon properties.
Active (November): 13,850
Coming Soon (November): 324
Total Inventory: 14,174
Active (Dec 1): 12,785
Coming Soon (Dec 1): 327
Total Inventory: 13,112
Inventory declined by 1,062 homes month over month. This is a standard seasonal pattern as many sellers temporarily remove listings for the holiday season. The drop is not demand-driven. Starting December with lower inventory typically sets the stage for tighter supply as we enter January.
- Homes Under Contract
Contracts: 4,472
This is a slight increase from October’s 4,462 which shows that committed buyers remain active despite the holiday slowdown.
- Supply and Demand Ratio
November: 31.48 percent
December 1: 34.11 percent
This ratio compares the number of homes under contract to the number of active listings.
• Around 30 percent or below reflects a strong buyer advantage
• Around 50 to 60 percent indicates a balanced market
• Numbers closer to 90 percent or above reflect a strong seller advantage
With the ratio increasing from 31.48 percent to 34.11 percent, the market remains firmly in buyer-favorable territory. The move upward reflects slightly improved demand, but it is still well below the level required for a balanced market.
What This Means for Buyers
- Buyers continue to hold meaningful negotiation leverage
• Monthly payments are more predictable due to rate stability
• Values are steady which reduces pressure and supports more thoughtful decisions
• Inventory is lower heading into December but still healthy compared to prior tight cycles
This environment favors buyers who value strategy, timing, and negotiation.
What This Means for Sellers
- Homes that are well prepared and accurately priced continue to sell
• Overpricing results in extended days on market
• Listing prep completed in December positions sellers well for early January when buyer activity starts to rise
• There is less competition during the holiday window for those who choose not to wait
Looking Ahead Through the Remainder of 2025
As we move further into December, the market should continue to follow typical seasonal patterns with softer showing activity and fewer new listings. Historically, the first notable wave of new inventory begins in mid to late January. Since total inventory started December more than 1,000 homes lower than the prior month, early 2026 may open with tighter supply if demand holds steady.
My role is to help you interpret the data, anticipate upcoming market movement, and make informed decisions whether you are considering buying, selling, or preparing your next move.
If you have any questions, please feel free to reach out to Michael Hankerson at 602.770.7205
#LinkBrokerages