If prices are up in October, then why is November the most favorable market for home buyers in 2025?
Metro Phoenix Housing Update – October 2025
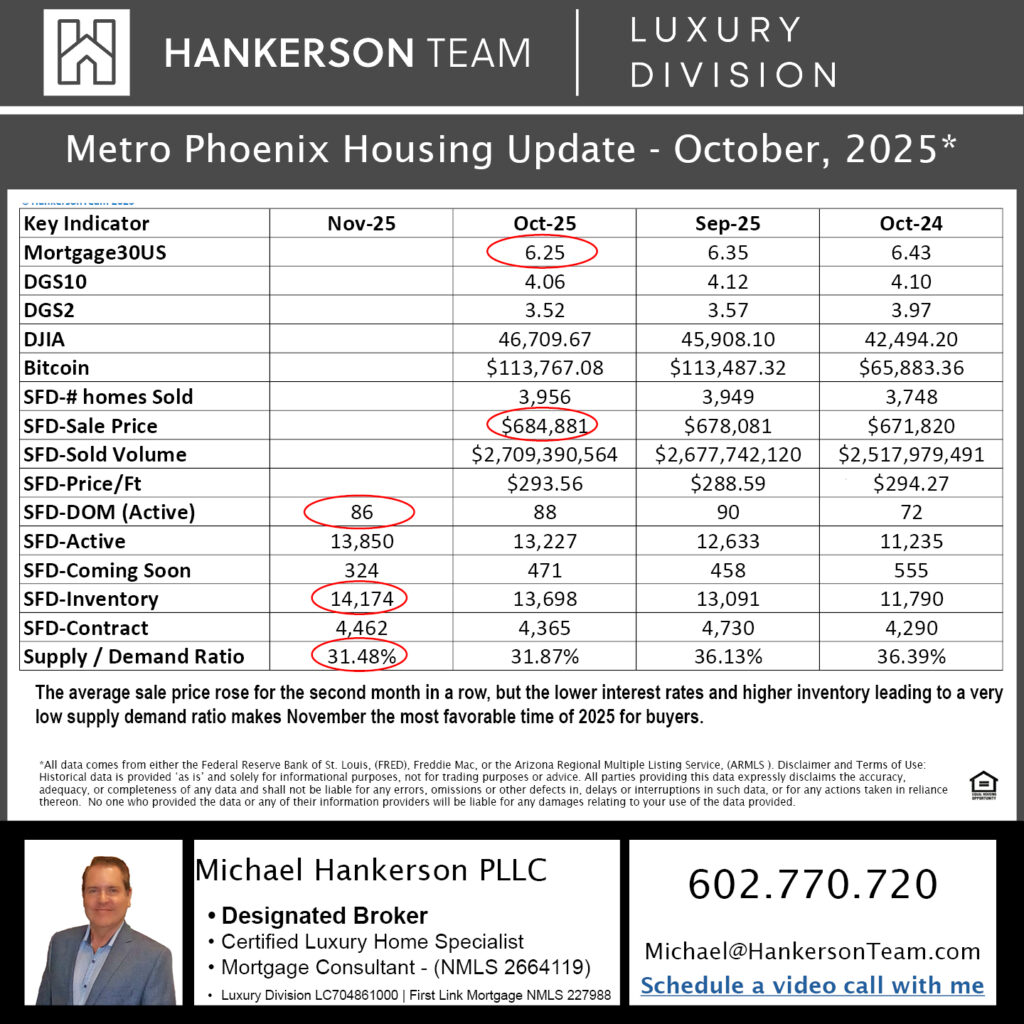
If prices are up in October, then why is November shaping up to be the most favorable market for home buyers in 2025?
Hi, it’s Michael Hankerson with the Hankerson Team | Luxury Division and First Link Mortgage.
As of November 1st, 2025, we now have a clear picture of how the Metro Phoenix housing market performed in October — and the results reveal a unique moment for buyers.
Home Prices Rose Again — But the Advantage Is Shifting
In October, home prices and price per square foot increased slightly for the second consecutive month, signaling continued strength in property values.
The average sale price climbed to $685,581, up just over 1% from September and 2% higher than a year ago.
Price per square foot rose to $293.61, compared to $288.59 last month.
A total of 3,931 single-family detached homes sold across Maricopa County, virtually unchanged from September but higher than the same time last year.
The average number of days on market dropped again — from 88 in September to 86 in October — showing that well-priced homes are still moving quickly.
Inventory Growth Creates Opportunity for Buyers
For the fifth consecutive month, inventory increased, rising to 14,174 active homes for sale as of November 1st. Contracts also edged up slightly to 4,462, but because supply grew faster than demand, the Supply/Demand Ratio dropped to 31.48% — the lowest level in 2025.
This level of supply relative to demand places the market close to an Extreme Buyer’s Market, giving buyers the strongest negotiating position we’ve seen this year.
More available listings, improving interest rates, and steady pricing have combined to create a rare window of opportunity for buyers heading into the end of 2025.
Why the Supply/Demand Ratio Matters
The Supply/Demand Ratio is one of the most forward-looking indicators in real estate.
It compares how many homes are for sale (supply) to how many are under contract (demand), revealing who holds the advantage in negotiations.
A ratio near 30% or below signals an Extreme Buyer’s Market, while a ratio around 50–60% represents a Balanced Market, and 90% or higher defines an Extreme Seller’s Market.
For a full explanation of how this metric impacts pricing and negotiation, read our in-depth guide:
➡️ Extreme Buyer’s Market, Balanced Market, and Extreme Seller’s Market—Explained
The Bottom Line
Even though prices ticked upward in October, November’s conditions present a rare opportunity for buyers — lower interest rates, increased supply, and greater negotiating room.
If you’re considering buying, selling, or refinancing before year-end, now is the time to explore your options strategically.
Contact me directly at (602) 770-7205 or schedule a private consultation at
🔗 Book a Call with Michael Hankerson.
Hankerson Team | Luxury Division
Representing Scottsdale and Metro Phoenix Luxury Real Estate
Brokered by Link Brokerages