A Look Into Arizona’s Luxury Housing Market
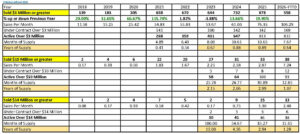
Look at what the luxury numbers are actually doing. Homes at $3 million and above are selling fast enough to push 2026 past 1,000 sales, a level Arizona has never reached. The $14 million-plus segment is running at close to twice last year’s record pace. And $10 million-plus homes have already outsold any full year we have ever recorded, in five months.
Metro Phoenix Housing Update May 2026
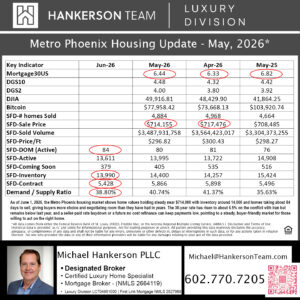
As of June 1, 2026, the Metro Phoenix housing market shows home values holding steady near $714,000 with inventory around 14,000 and homes taking about 84 days to sell, giving buyers more choice and negotiating room than they have had in years. The 30-year rate has risen to about 6.5% on the conflict with Iran but remains below last year, and a seller-paid rate buydown or a future no cost refinance can keep payments low, pointing to a steady, buyer-friendly market for those willing to act on the right home.

3 Ways Self-Employed Homeowners Can Access Equity Without Tax Returns
Self-employed homeowners may be able to access home equity without relying on traditional tax return documentation. Bank statement programs can offer three possible paths: a cash-out refinance, closed-end second mortgage, or HELOC.

Your Home Has Equity. Do Not Miss a Payment
If life just threw you a curveball and you own a home with equity, there is one thing you need to know before you miss that next payment. The window is smaller than you think.

Seven Ways to Access the Equity in Your Home
Most homeowners who have thought about accessing their equity have assumed it means one thing — refinancing their mortgage. For many of them, that one assumption has been the reason they stopped looking. There are six other options.
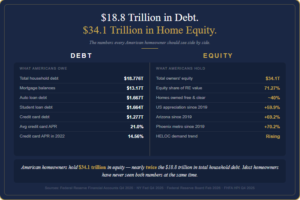
$18.8 Trillion in Debt. $34.1 Trillion in Home Equity. Most Americans Have Never Seen Both Numbers at the Same Time.
Most people know roughly what they owe. Almost nobody knows, in specific dollar terms, what they own. This article puts both Federal Reserve numbers on the same page.
2 Responses