Metro Phoenix Housing Market update: March 2025
Key Market Indicators – March 2025
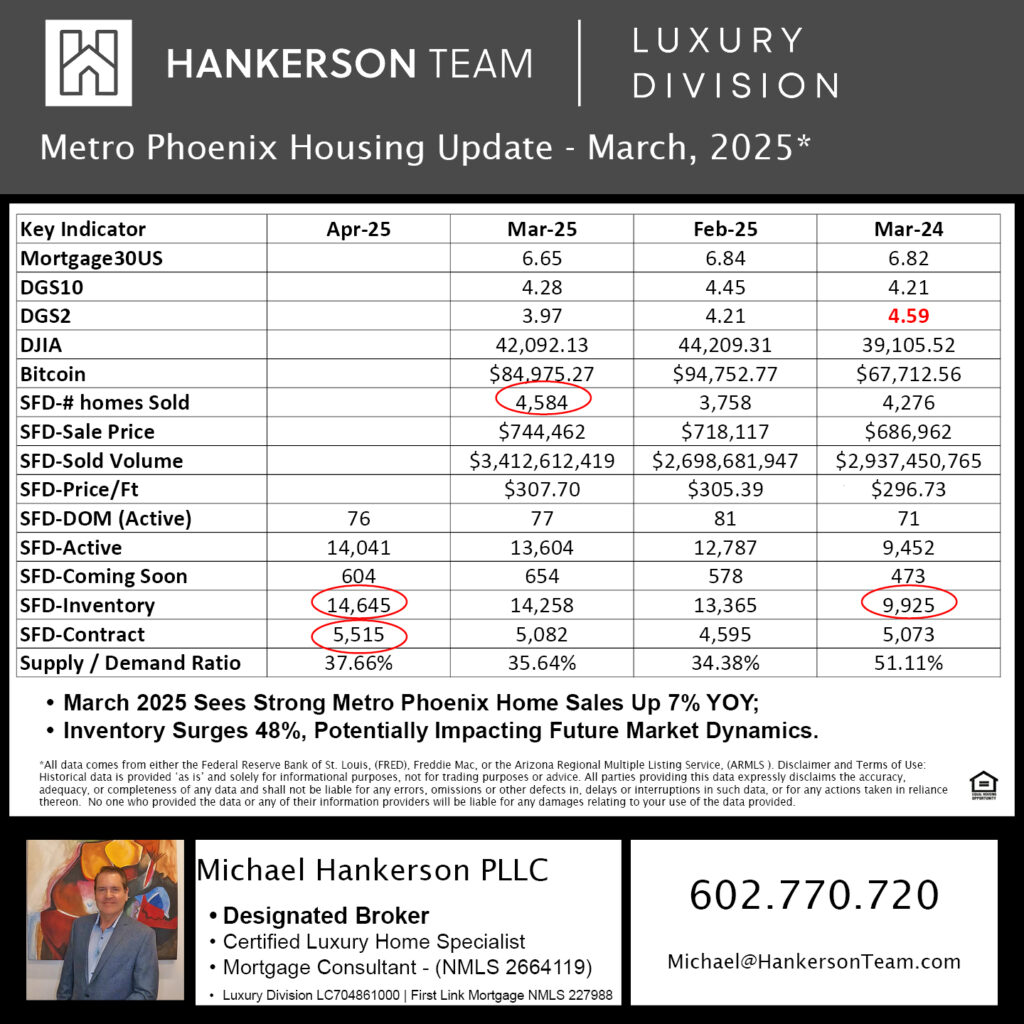
It’s April 2, 2025, and while the numbers are not yet finalized, they are close enough to provide an insight into how the Metro Phoenix housing market is performing. Historically, March is a strong month for home sales in this area, partly due to the influx of visitors. In comparison to the 2,992 homes sold in January and the 3,758 homes sold in February, the 4,584 homes sold in March represent a significant increase and are up by 7% from the same period last year. After a notable dip in February, home prices have returned to their January levels. The average rate for a 30-year mortgage has decreased for the third consecutive month, and similarly, the number of days it takes to sell a home has also declined. The number of homes under contract has risen by 9% from last year and by 2,187 homes since January, now totaling 5,515. A concerning factor is the inventory of available homes, which has increased by 48% from last year and now exceeds 14,500 single-family detached homes for sale on the MLS in Maricopa County. Traditionally, the housing market in the Metro Phoenix area begins to decline in June, a trend that continues through August. If the number of available homes remains stable and demand returns to February levels, the supply-demand ratio would fall to 24%, placing home sellers in a challenging negotiating position.