Q1-2025 Metro Phoenix Housing Market Update
Q1-2025 Housing Update for the Metro Phoenix Area
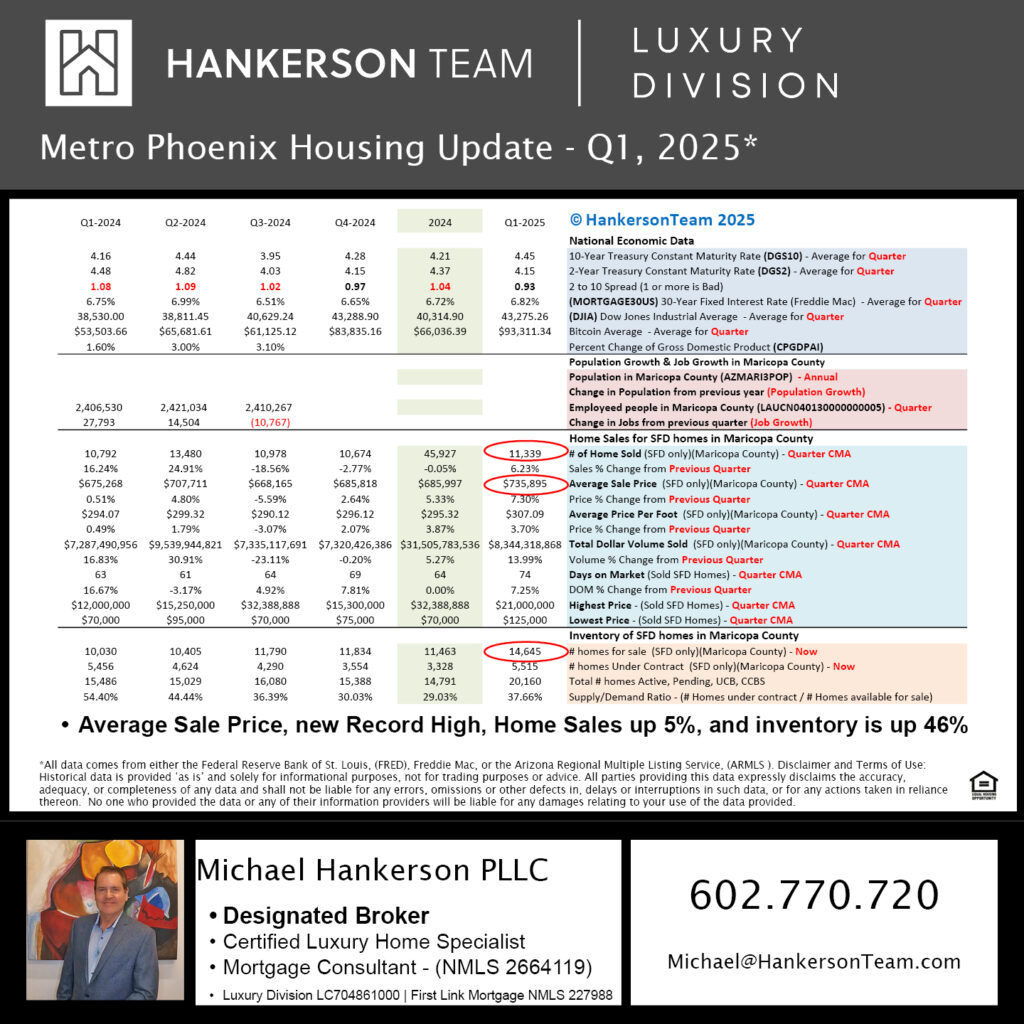
We analyze National Economic Data, Home Sales for Single Family Detached (SFD) homes in Maricopa County, and the inventory of SFD homes in Maricopa County on a monthly basis. Given the potential for significant fluctuations from month to month, we also compile reports quarterly and annually. Our report for the first quarter of 2025 highlights three new record highs:
1. The average price for Bitcoin was $93,311.34.
2. The average sale price of an SFD home sold on the MLS in Maricopa County was $735,895.
3. The number of SFD homes for sale in the MLS in Maricopa County was 14,645.
The purpose of producing these reports is to better understand the housing market and to provide our clients with an advantage by highlighting trends that might influence prices to rise or fall. In our monthly reports, I have highlighted the fact that both demand and supply are higher than they were the previous month and higher than last year. I cautioned that if demand drops in June, which it typically does, the high inventory levels could put significant downward pressure on home prices. When viewed quarterly, you see a similar story: home sales are up by 5%, homes under contract are up by 1%, but the inventory of homes is up by 46%. This indicates that while demand is increasing, inventory is rising even more sharply. Therefore, the two headlines you might take away from this data are:
1. Home prices have reached a new record high, so it is a great time to sell.
2. The inventory of homes for sale has reached a new record high; there could be trouble this summer.