The average sale price dropped by $28,625
This shouldn’t come as a surprise to my clients and those who follow me, as it happens every year. July is the worst time to sell a house in Arizona.
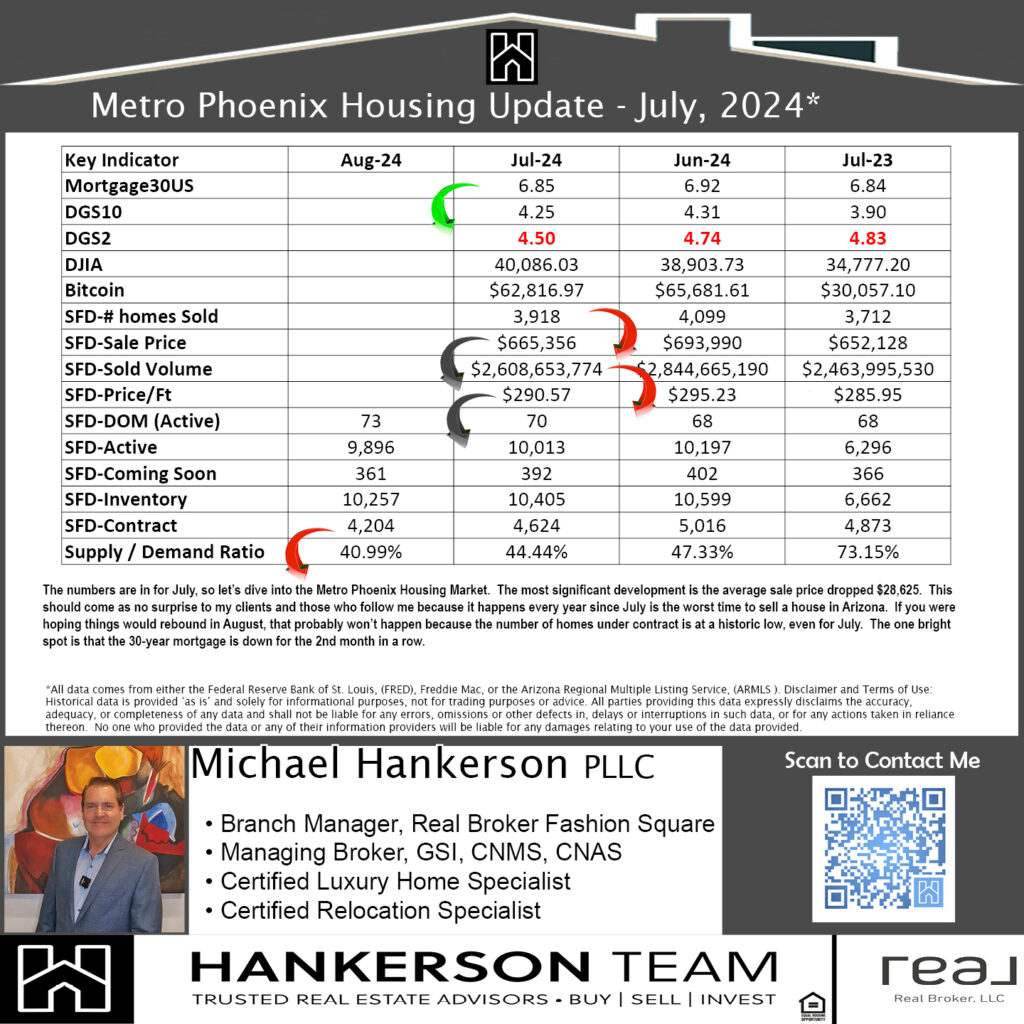
Hi, it’s Michael Hankerson. The numbers for July are in, so let’s dive into the Metro Phoenix Housing Market.
The most significant development is that the average sale price dropped by $28,625. This shouldn’t come as a surprise to my clients and those who follow me, as it happens every year. July is the worst time to sell a house in Arizona.
If you were hoping for a rebound in August, that probably won’t happen. The number of homes under contract is at a historic low, even for August 1st.
One bright spot is that the 30-year mortgage rate is down for the second month in a row.
If you have any questions, please feel free to reach out by direct message, text, phone call phone call 📞 at 602.770.7205, or email. Thanks, and have a great day!
Metro Phoenix Housing Market Update: July 2024
Hi everyone, it’s Michael Hankerson. Today, we’re diving into the Metro Phoenix Housing Market numbers for July 2024. The most significant development this month is the average sale price dropping by $28,625. This shouldn’t come as a surprise to my clients and followers, as it happens every year; July is historically the worst time to sell a house in Arizona.
Key Market Indicators
Let’s break down the key market indicators and what they mean for buyers and sellers in the Metro Phoenix area:
Average Sale Price
- July 2024: $665,356
- June 2024: $693,990
- July 2023: $652,128
The average sale price for single-family detached homes dropped by $28,625 from June to July 2024. This decrease is a typical seasonal trend, as July is usually a slow month for the housing market in Arizona.
Number of Homes Sold
- July 2024: 3,918
- June 2024: 4,099
- July 2023: 3,712
The number of homes sold in July 2024 decreased slightly from June but was higher compared to July 2023. This indicates a relatively stable market despite the seasonal decline.
Sale Volume
- July 2024: $2,608,653,774
- June 2024: $2,844,665,190
- July 2023: $2,463,995,530
The total sale volume also saw a drop from June to July 2024, aligning with the decrease in the average sale price and the number of homes sold.
Price per Square Foot
- July 2024: $290.57
- June 2024: $295.23
- July 2023: $285.95
The price per square foot experienced a minor decrease from June to July 2024, reflecting the overall market trend of declining prices during this period.
Days on Market (Active)
- July 2024: 73 days
- June 2024: 70 days
- July 2023: 68 days
Homes are staying on the market a bit longer, with the average days on market increasing to 73 days in July 2024. This is typical for the slower summer months.
Active Listings and Inventory
- Active Listings (July 2024): 9,896
- June 2024: 10,013
- July 2023: 6,296
- Total Inventory (July 2024): 10,257
- June 2024: 10,405
- July 2023: 6,662
The number of active listings and total inventory has decreased slightly from June to July 2024 but remains significantly higher than July 2023. This indicates a more saturated market compared to last year.
Homes Under Contract
- July 2024: 4,204
- June 2024: 4,624
- July 2023: 4,873
The number of homes under contract is at a historic low, even for July, which suggests a slower market moving into August.
Economic Indicators
30-Year Mortgage Rate
- July 2024: 6.92%
- June 2024: 6.84%
The 30-year mortgage rate is down for the second month in a row, providing some relief for buyers looking to finance their homes.
Bitcoin Prices
- July 2024: $62,816.97
- June 2024: $65,681.61
- July 2023: $30,057.10
Bitcoin prices have also seen a decrease from June to July 2024, but remain significantly higher than July 2023, reflecting broader economic trends.
Conclusion
In summary, the Metro Phoenix Housing Market in July 2024 shows a typical seasonal slowdown with decreasing average sale prices, fewer homes sold, and longer days on the market. However, the decrease in the 30-year mortgage rate for the second month in a row offers a bright spot for prospective buyers.
If you have any questions or need more detailed information, please feel free to reach out by direct message, text, phone call 📞 at 602.770.7205, or email. Thanks, and have a great day!
For the most accurate and up-to-date information, always verify the data with ARMLS or other reliable sources. Visit HankersonTeam.com for more insights and updates on the housing market.