
The Metro Phoenix Housing Market Is Bumpy
Here’s what’s happening right now in the Metro Phoenix housing market. The average sale price of single-family detached homes sold on the MLS in Maricopa County is dropping fast:
• Down more than $22,000 in August
• Down more than $60,000 this summer
• Down more than $100,000 since January
• Days on Market now sits at 90
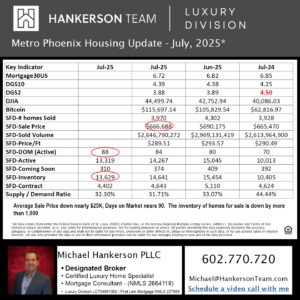
Metro Phoenix Housing Market Update | July 2025
The average sale price is down by about $25,000, which is typical for July. The average number of days on market also increased, reflecting the seasonal slowdown.

Understanding Buyer’s Market, Balanced Market, and Seller’s Market in Arizona
Markets shift over time, and whether the current environment favors buyers or sellers has a major impact on pricing strategy, offer readiness, and timing. This article explains the differences between market types and what each means for buyers and sellers in Arizona.
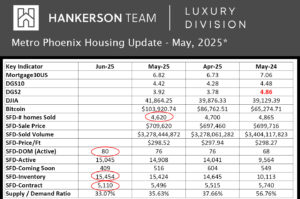
Metro Phoenix Housing Update – May 2025
Inventory increased slightly compared to last month and is up 53% year-over-year. The average number of days homes have been on the market rose to 80. Both closed sales and the number of homes under contract declined.

15 Key Stats That Reveal Where the Phoenix Housing Market Is Headed
Wondering where the Phoenix housing market is headed?
We break down the 15 key stats that matter most—from mortgage rates and inventory to Bitcoin and luxury sales trends. Whether you’re buying, selling, or investing, these insights help you make smarter real estate decisions in Metro Phoenix.

Two $30 Million Deals Closed on the Same Day in Metro Phoenix
Two $30 Million Deals Closed on the Same Day in Metro Phoenix?
It happened on May 22nd — and that’s not all. Two major price drops could signal fresh opportunities.
👉 Click to see what it means for buyers, sellers, and investors.
2 Responses